Tables
Tables bring structured data into Stagent — a built-in spreadsheet-meets-database where you can organize business metrics, track operational data, and build lightweight data workflows without leaving the workspace. Create tables from scratch, import from files, clone from templates, or let an agent build one from a plain-language description.
Key Concepts
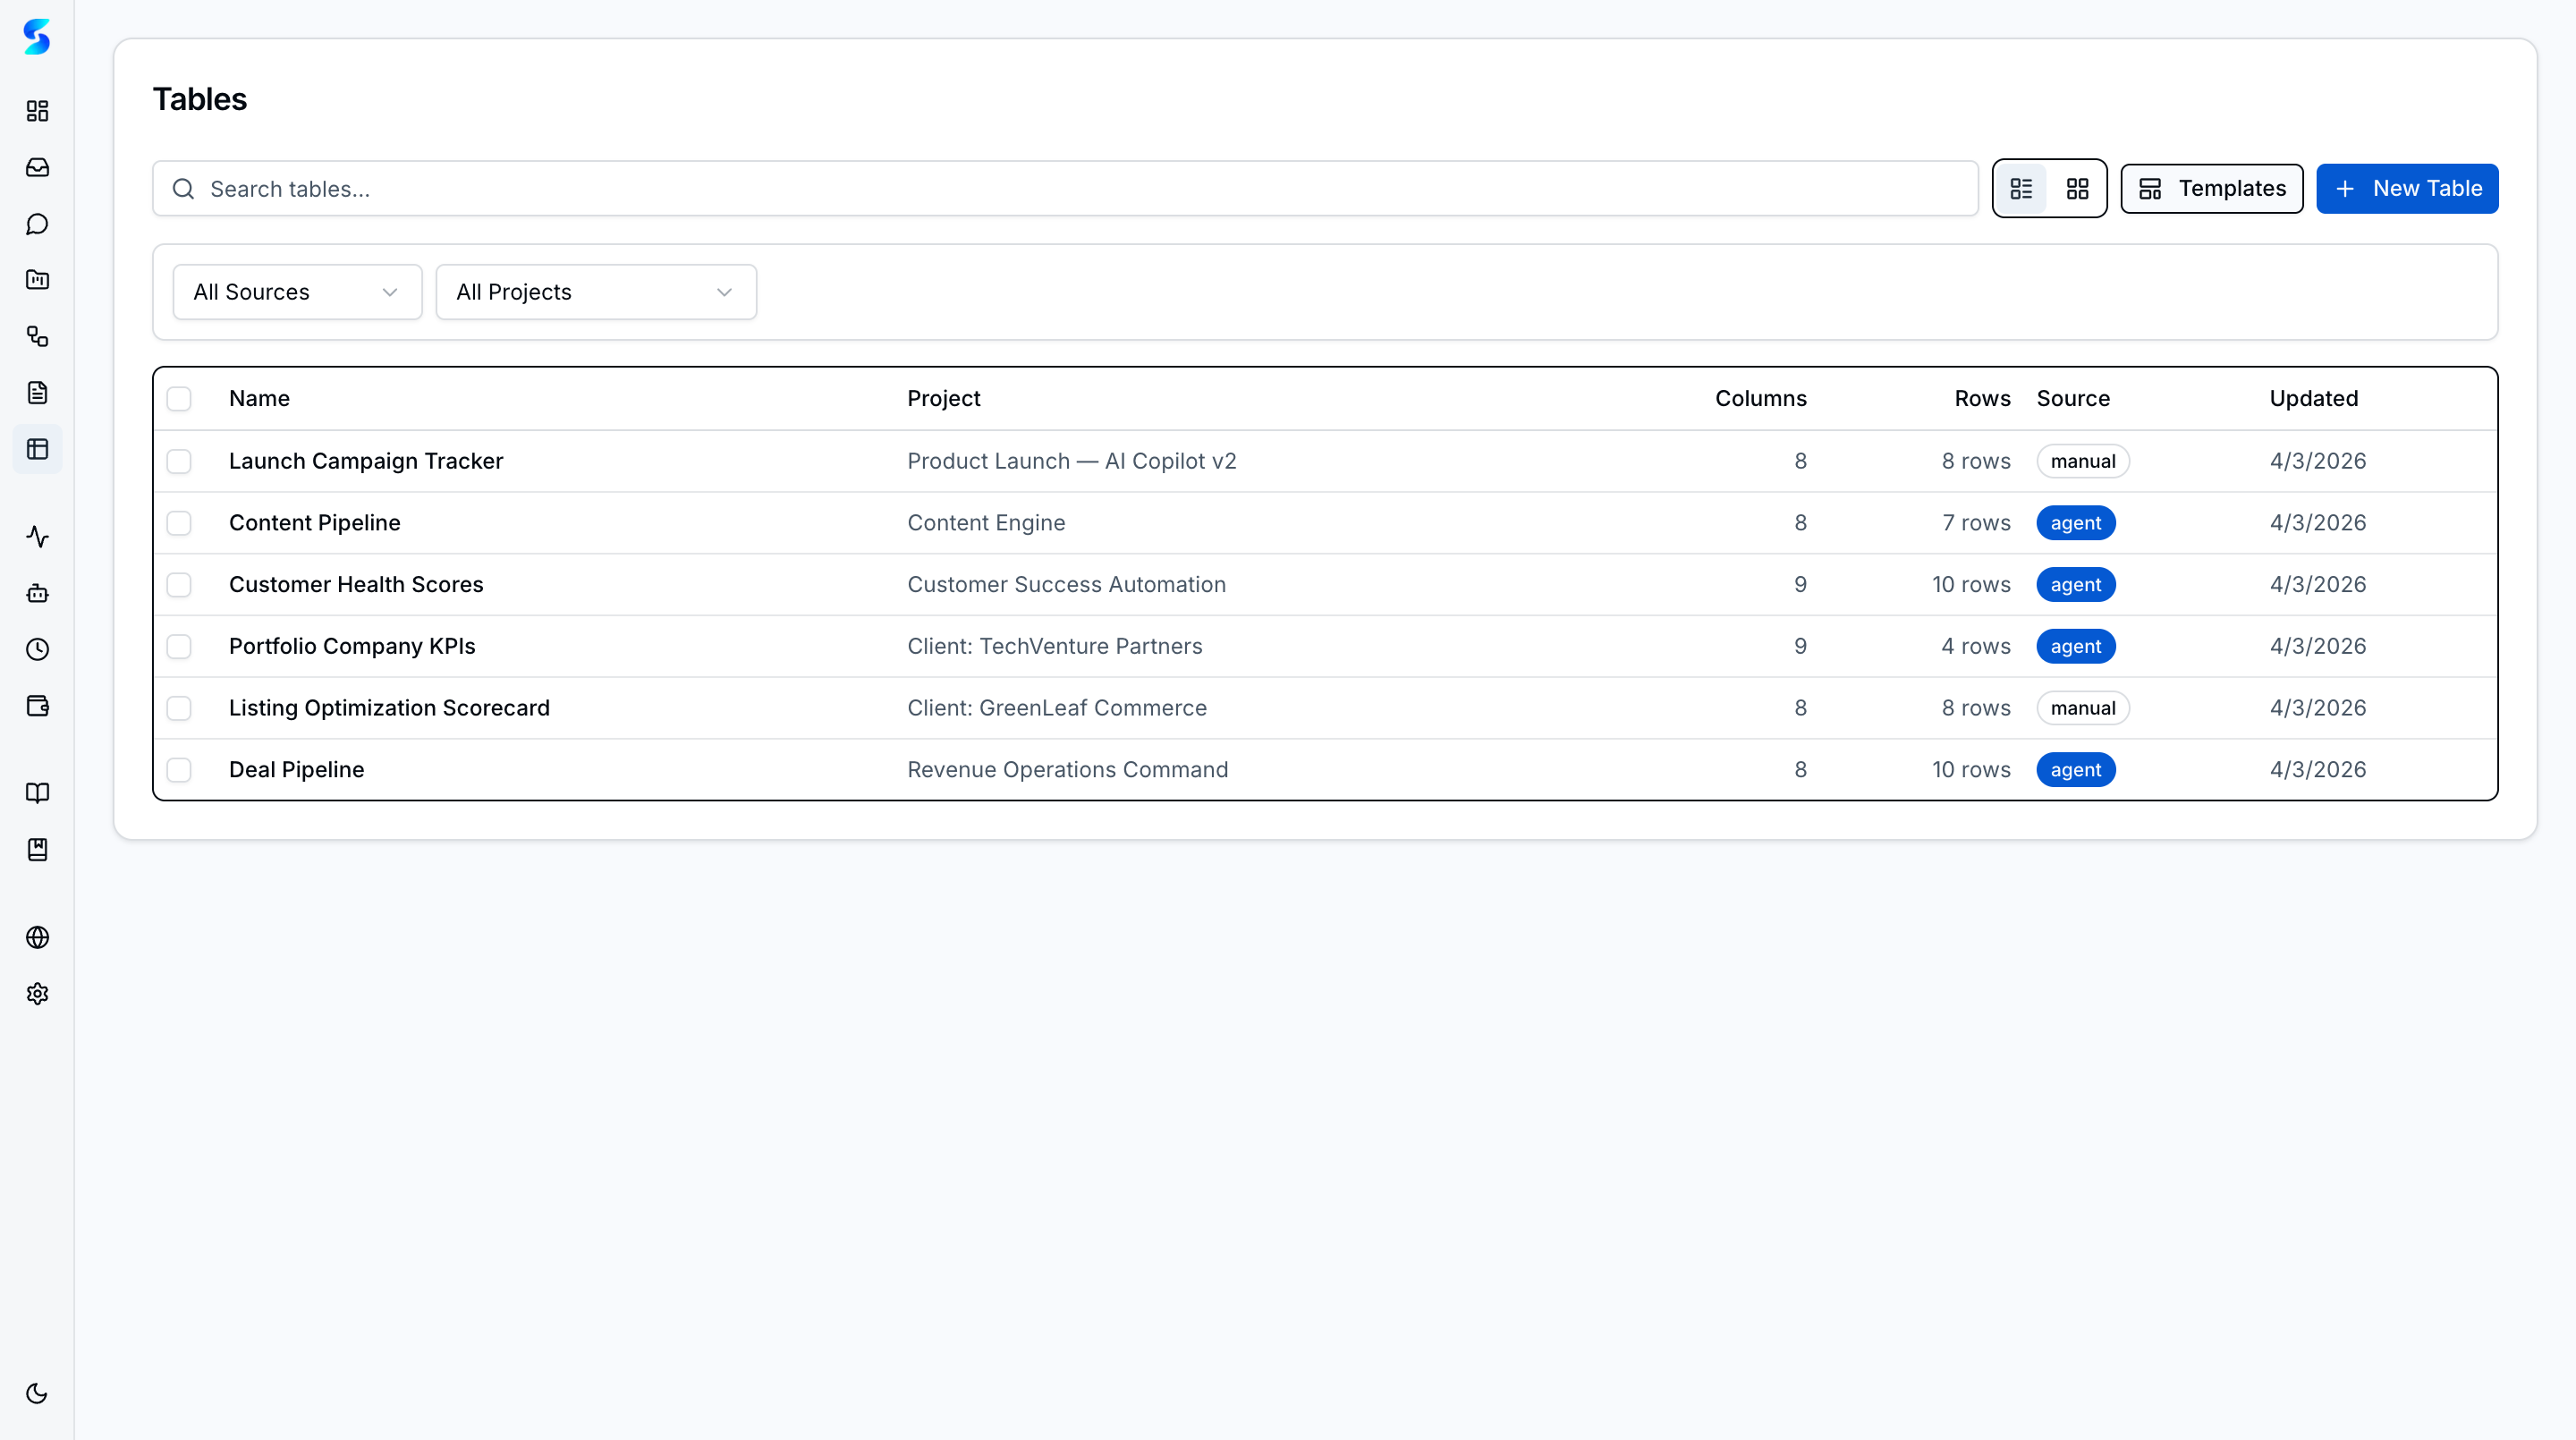
- Table and Grid Views — Browse all tables from a searchable list with source and project filters. Toggle between compact table and visual grid layouts.
- Spreadsheet Editor — Click any cell to edit inline. Arrow keys navigate between cells, Enter commits, Escape cancels. Type-aware editors render date pickers, checkboxes, dropdowns, and validated inputs per column type.
- Computed Columns — Add formula columns using 12 built-in functions (SUM, AVG, MIN, MAX, COUNT, IF, CONCAT, and more). Formulas auto-update and circular references are blocked.
- Document Import — Upload CSV, XLSX, or TSV files through a four-step wizard with auto-detected column types and preview.
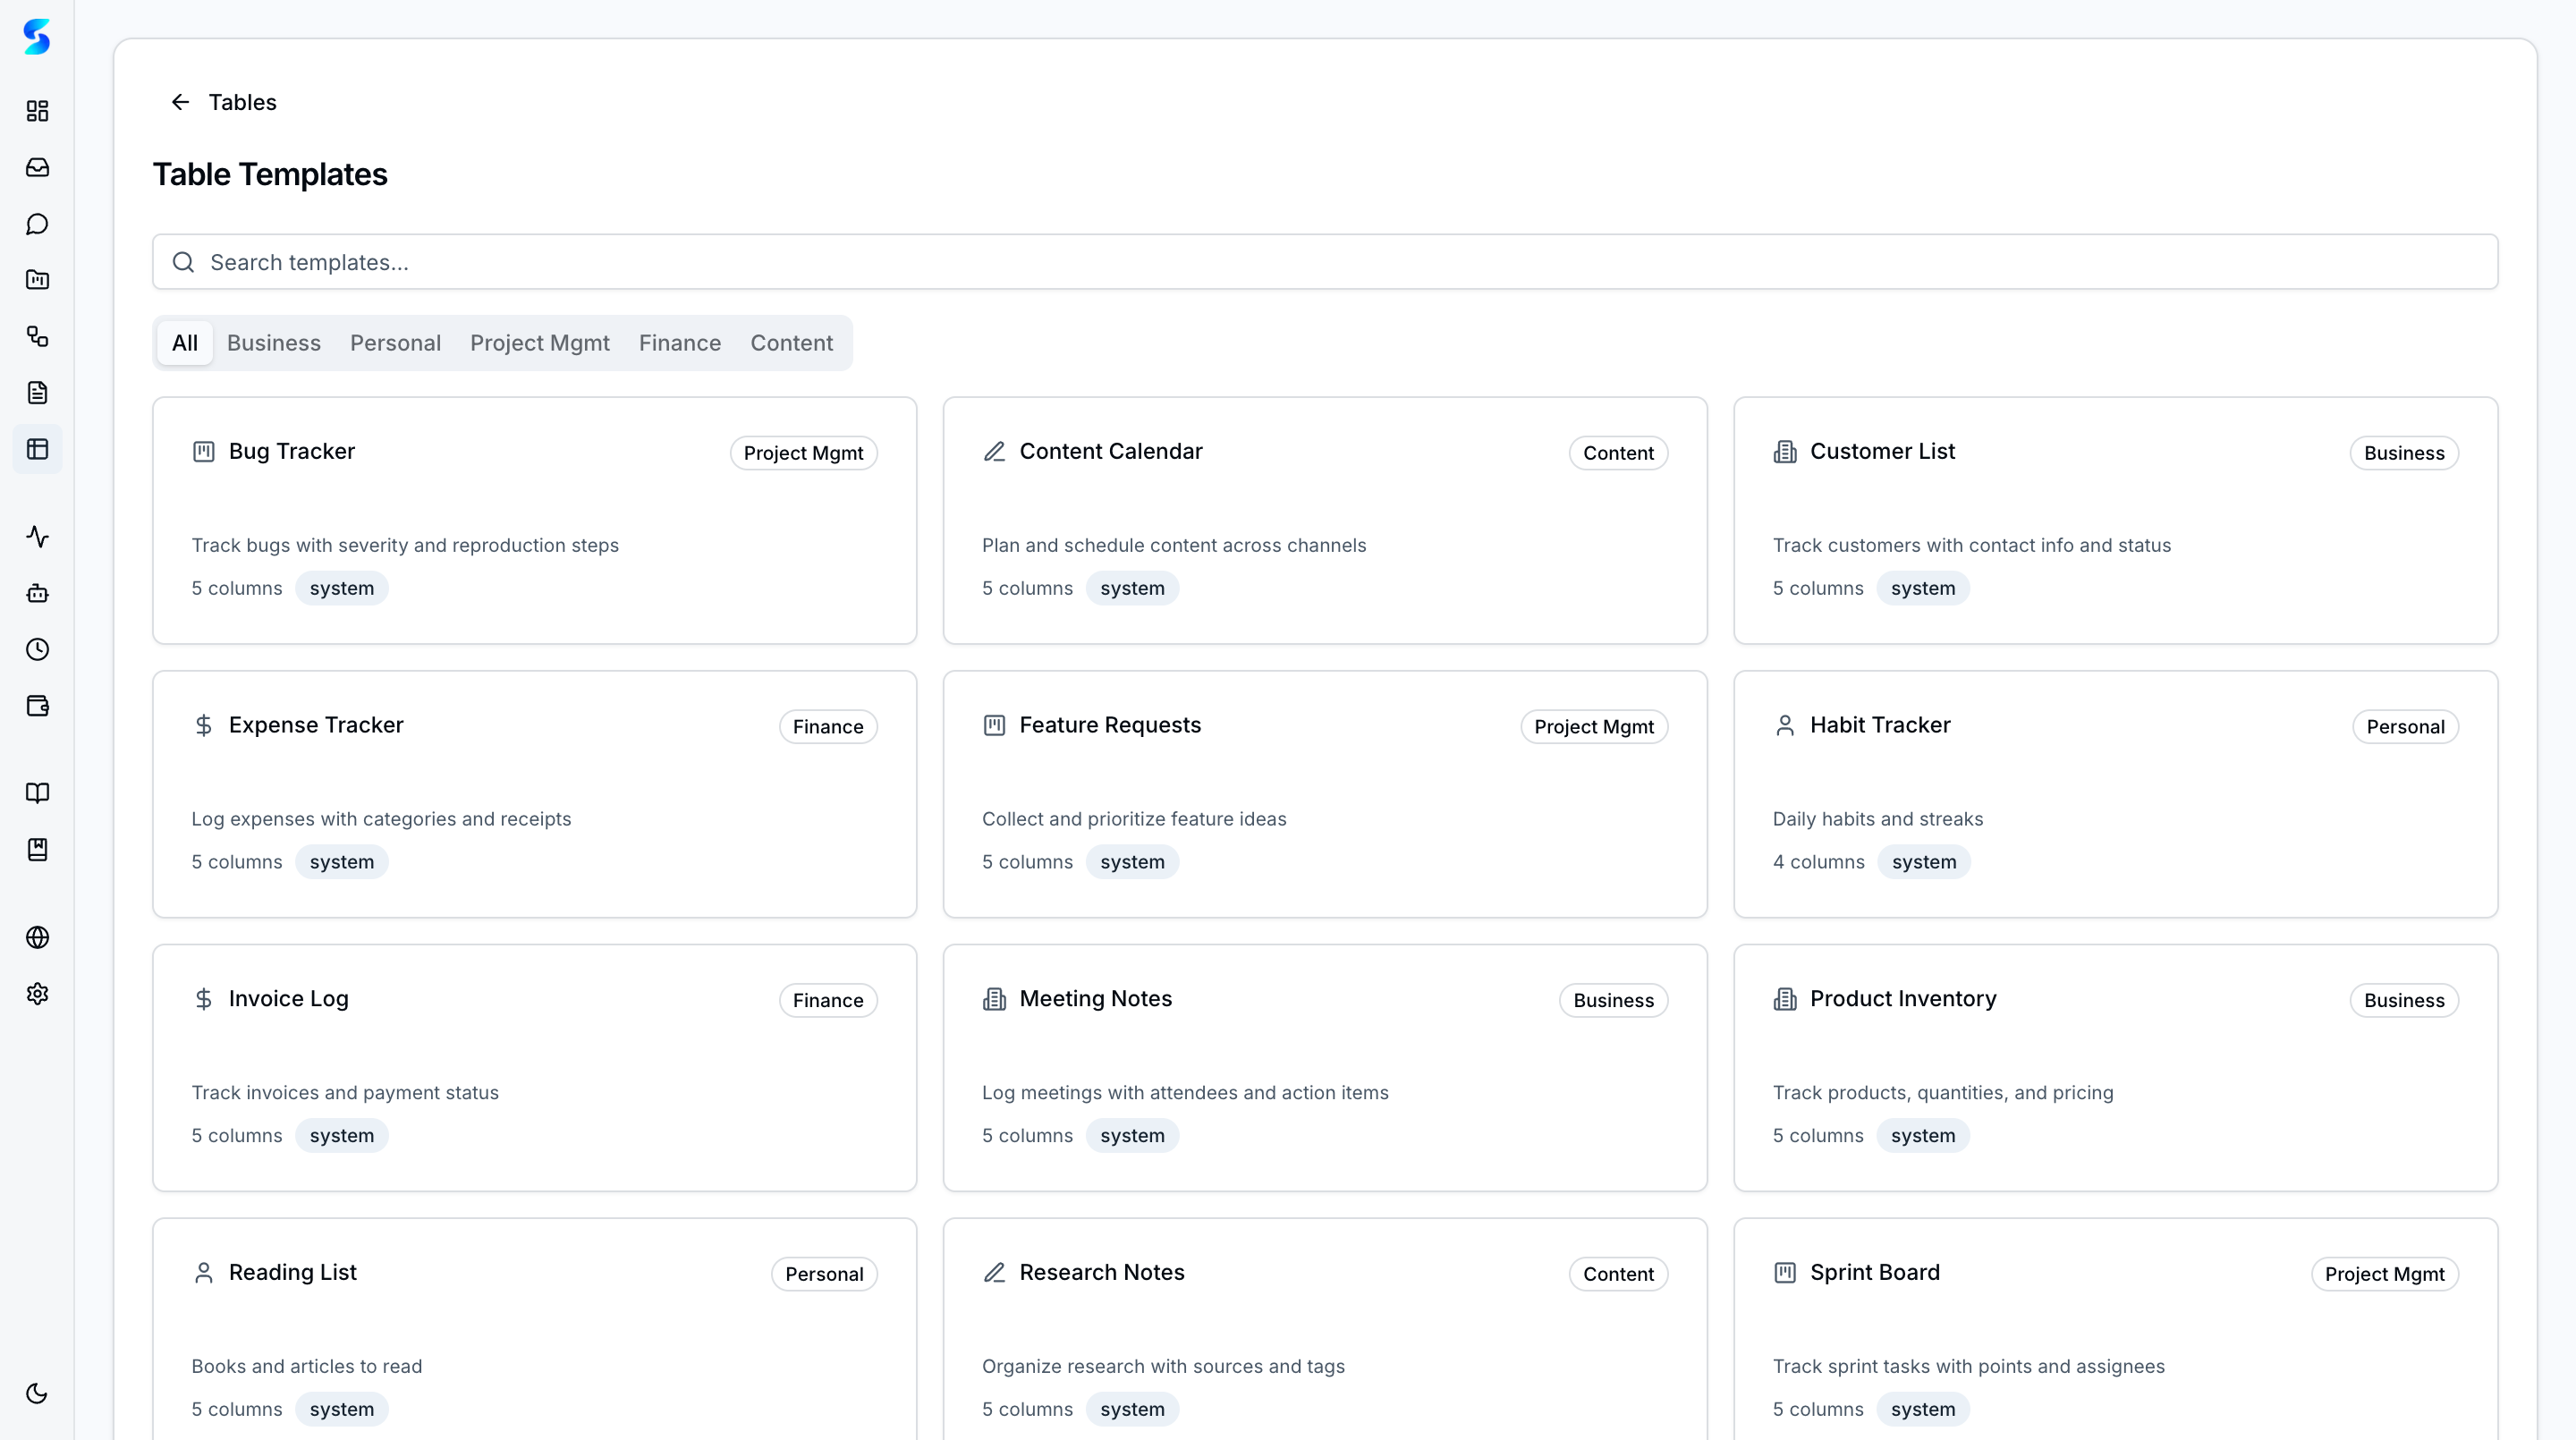
- Template Gallery — Browse categorized starter tables for common use cases — CRMs, project trackers, inventory lists, and more — then clone with one click.
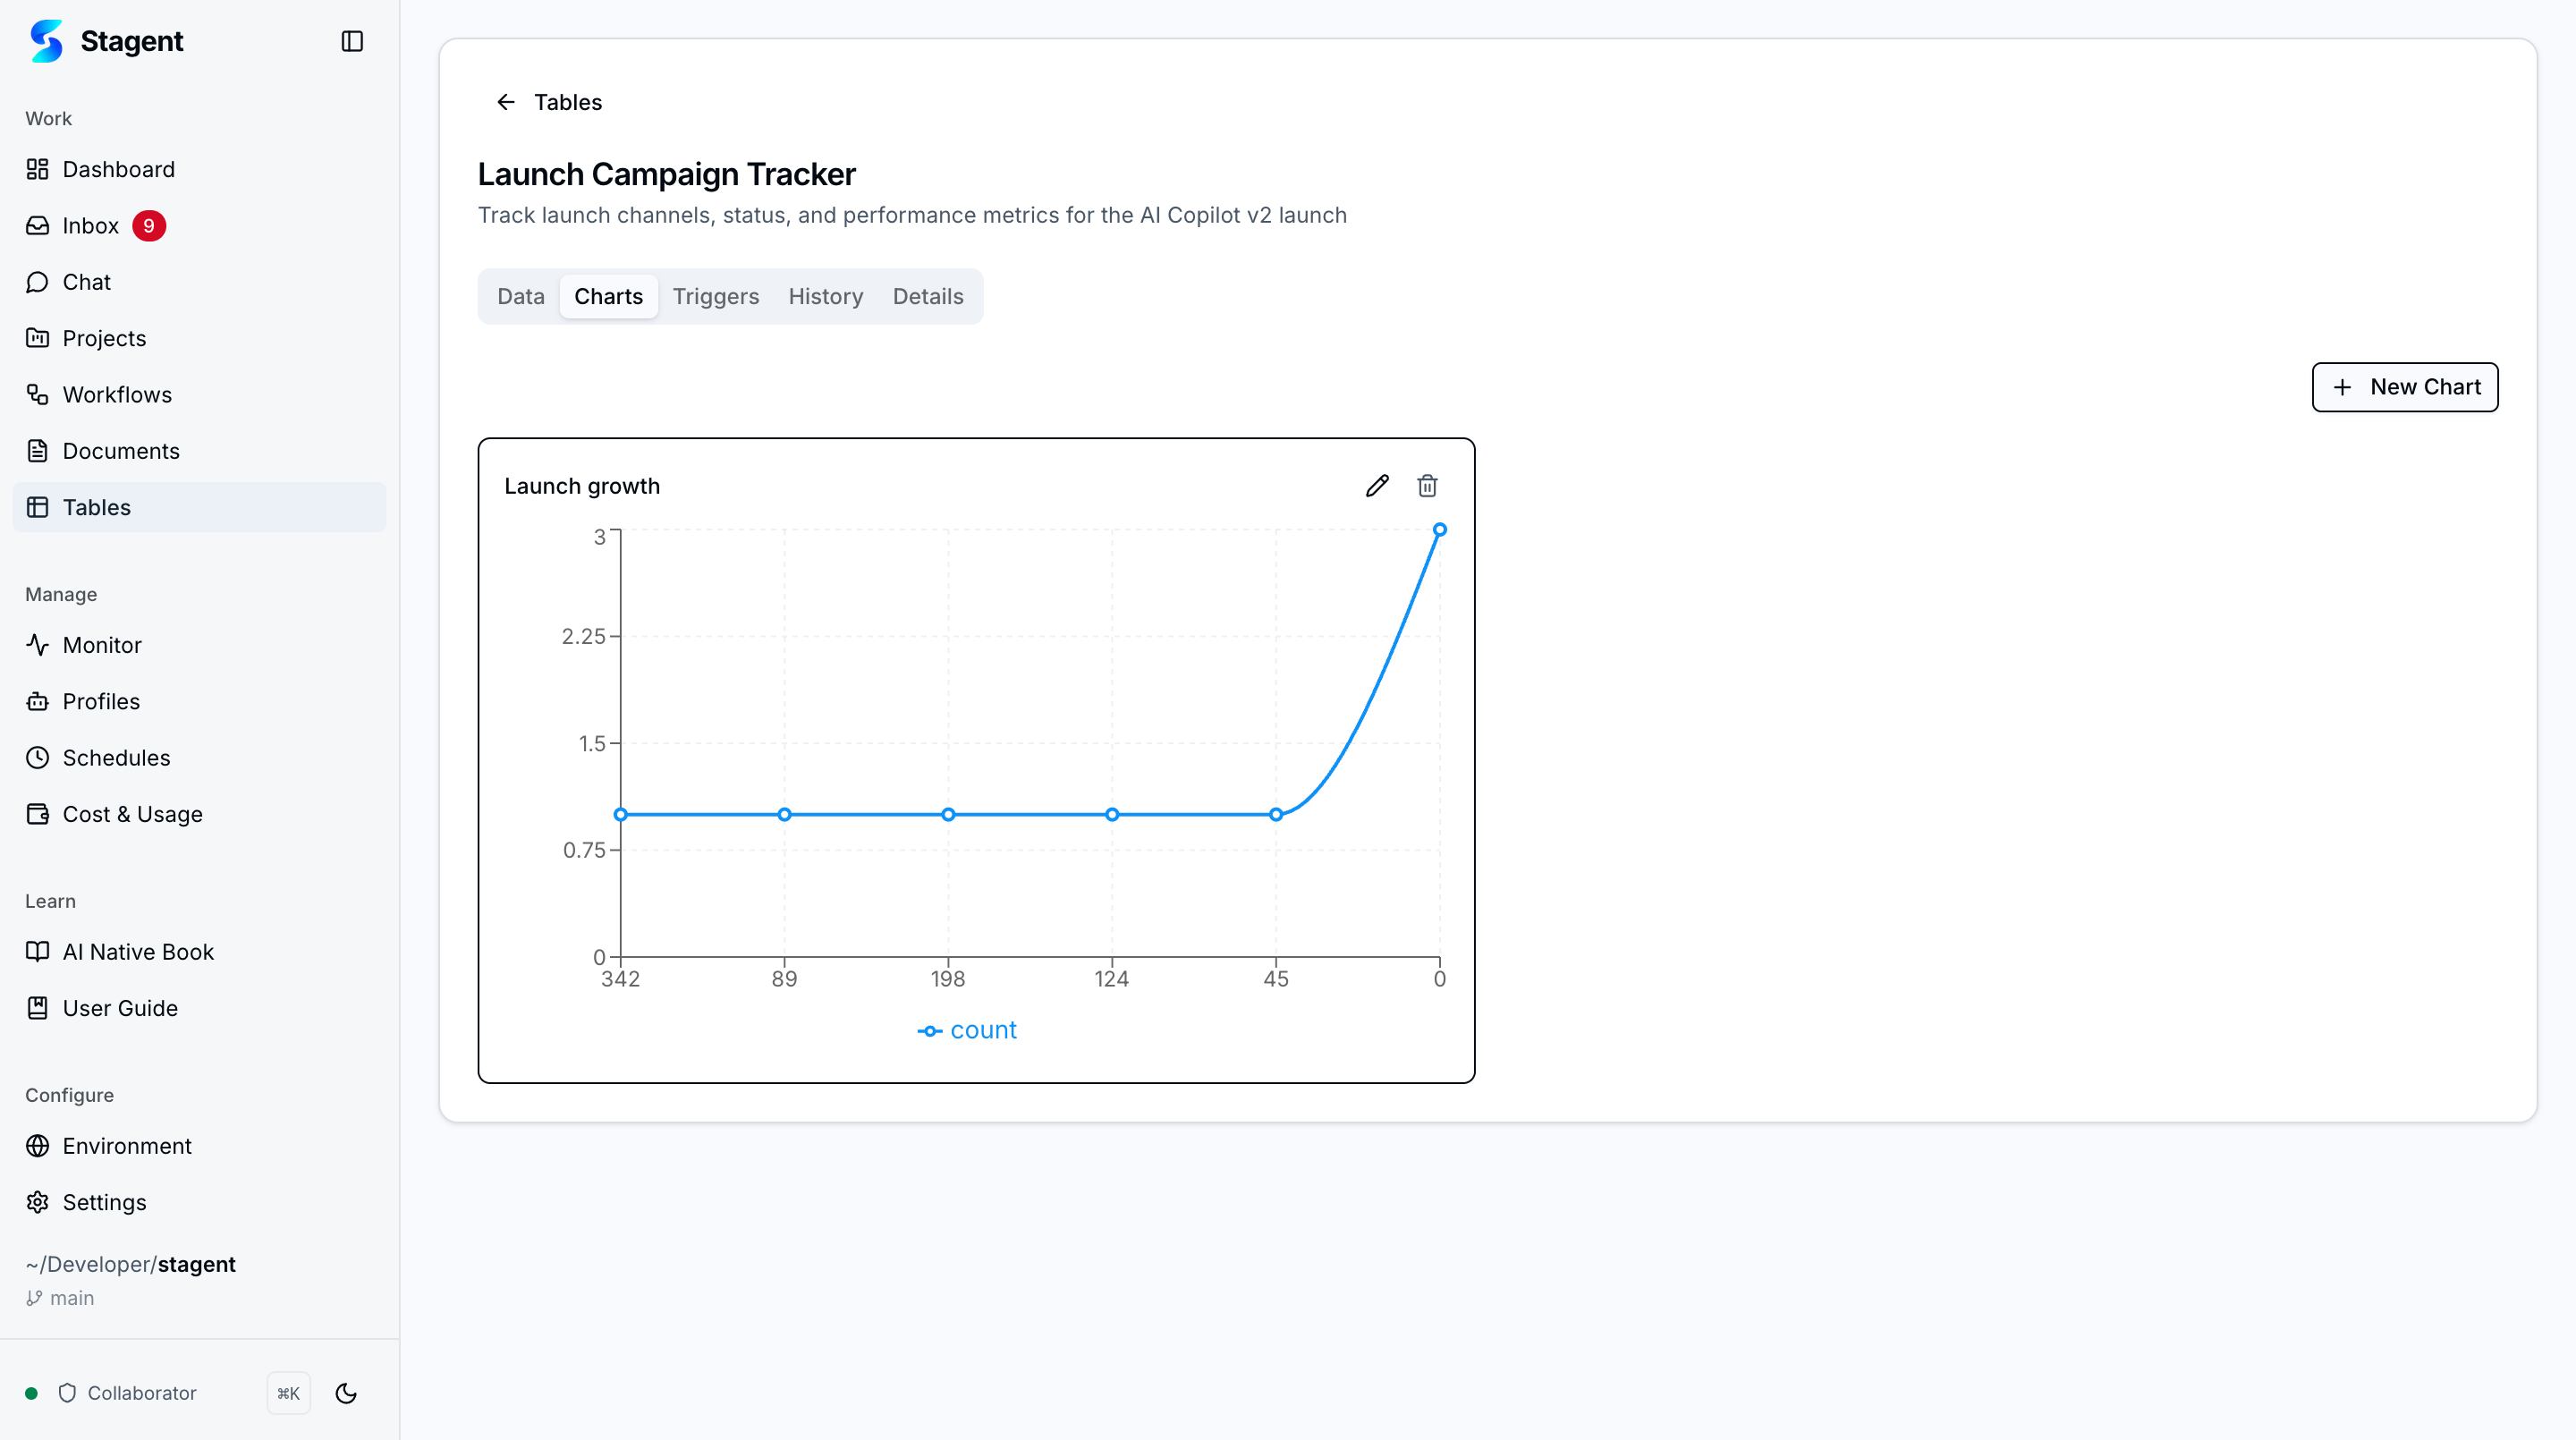
- Charts — Visualize data with bar, line, pie, or scatter charts directly from the Charts tab. Charts save alongside the table and update as data changes.
- Workflow Triggers — Define conditions on row changes and link them to workflows or agent tasks for automated actions.
- Cross-Table Relations — Link rows between tables with relation columns and a searchable combobox for live references.
- Agent Integration — Agents have full read-write access to tables during task execution — querying, filtering, aggregating, inserting, and updating rows.
- Natural-Language Creation — Describe a table in plain language and let an agent build it with appropriate column types.
- Export — Export any table to CSV, XLSX, or JSON for external tools, backups, or downstream processes.
How It Works
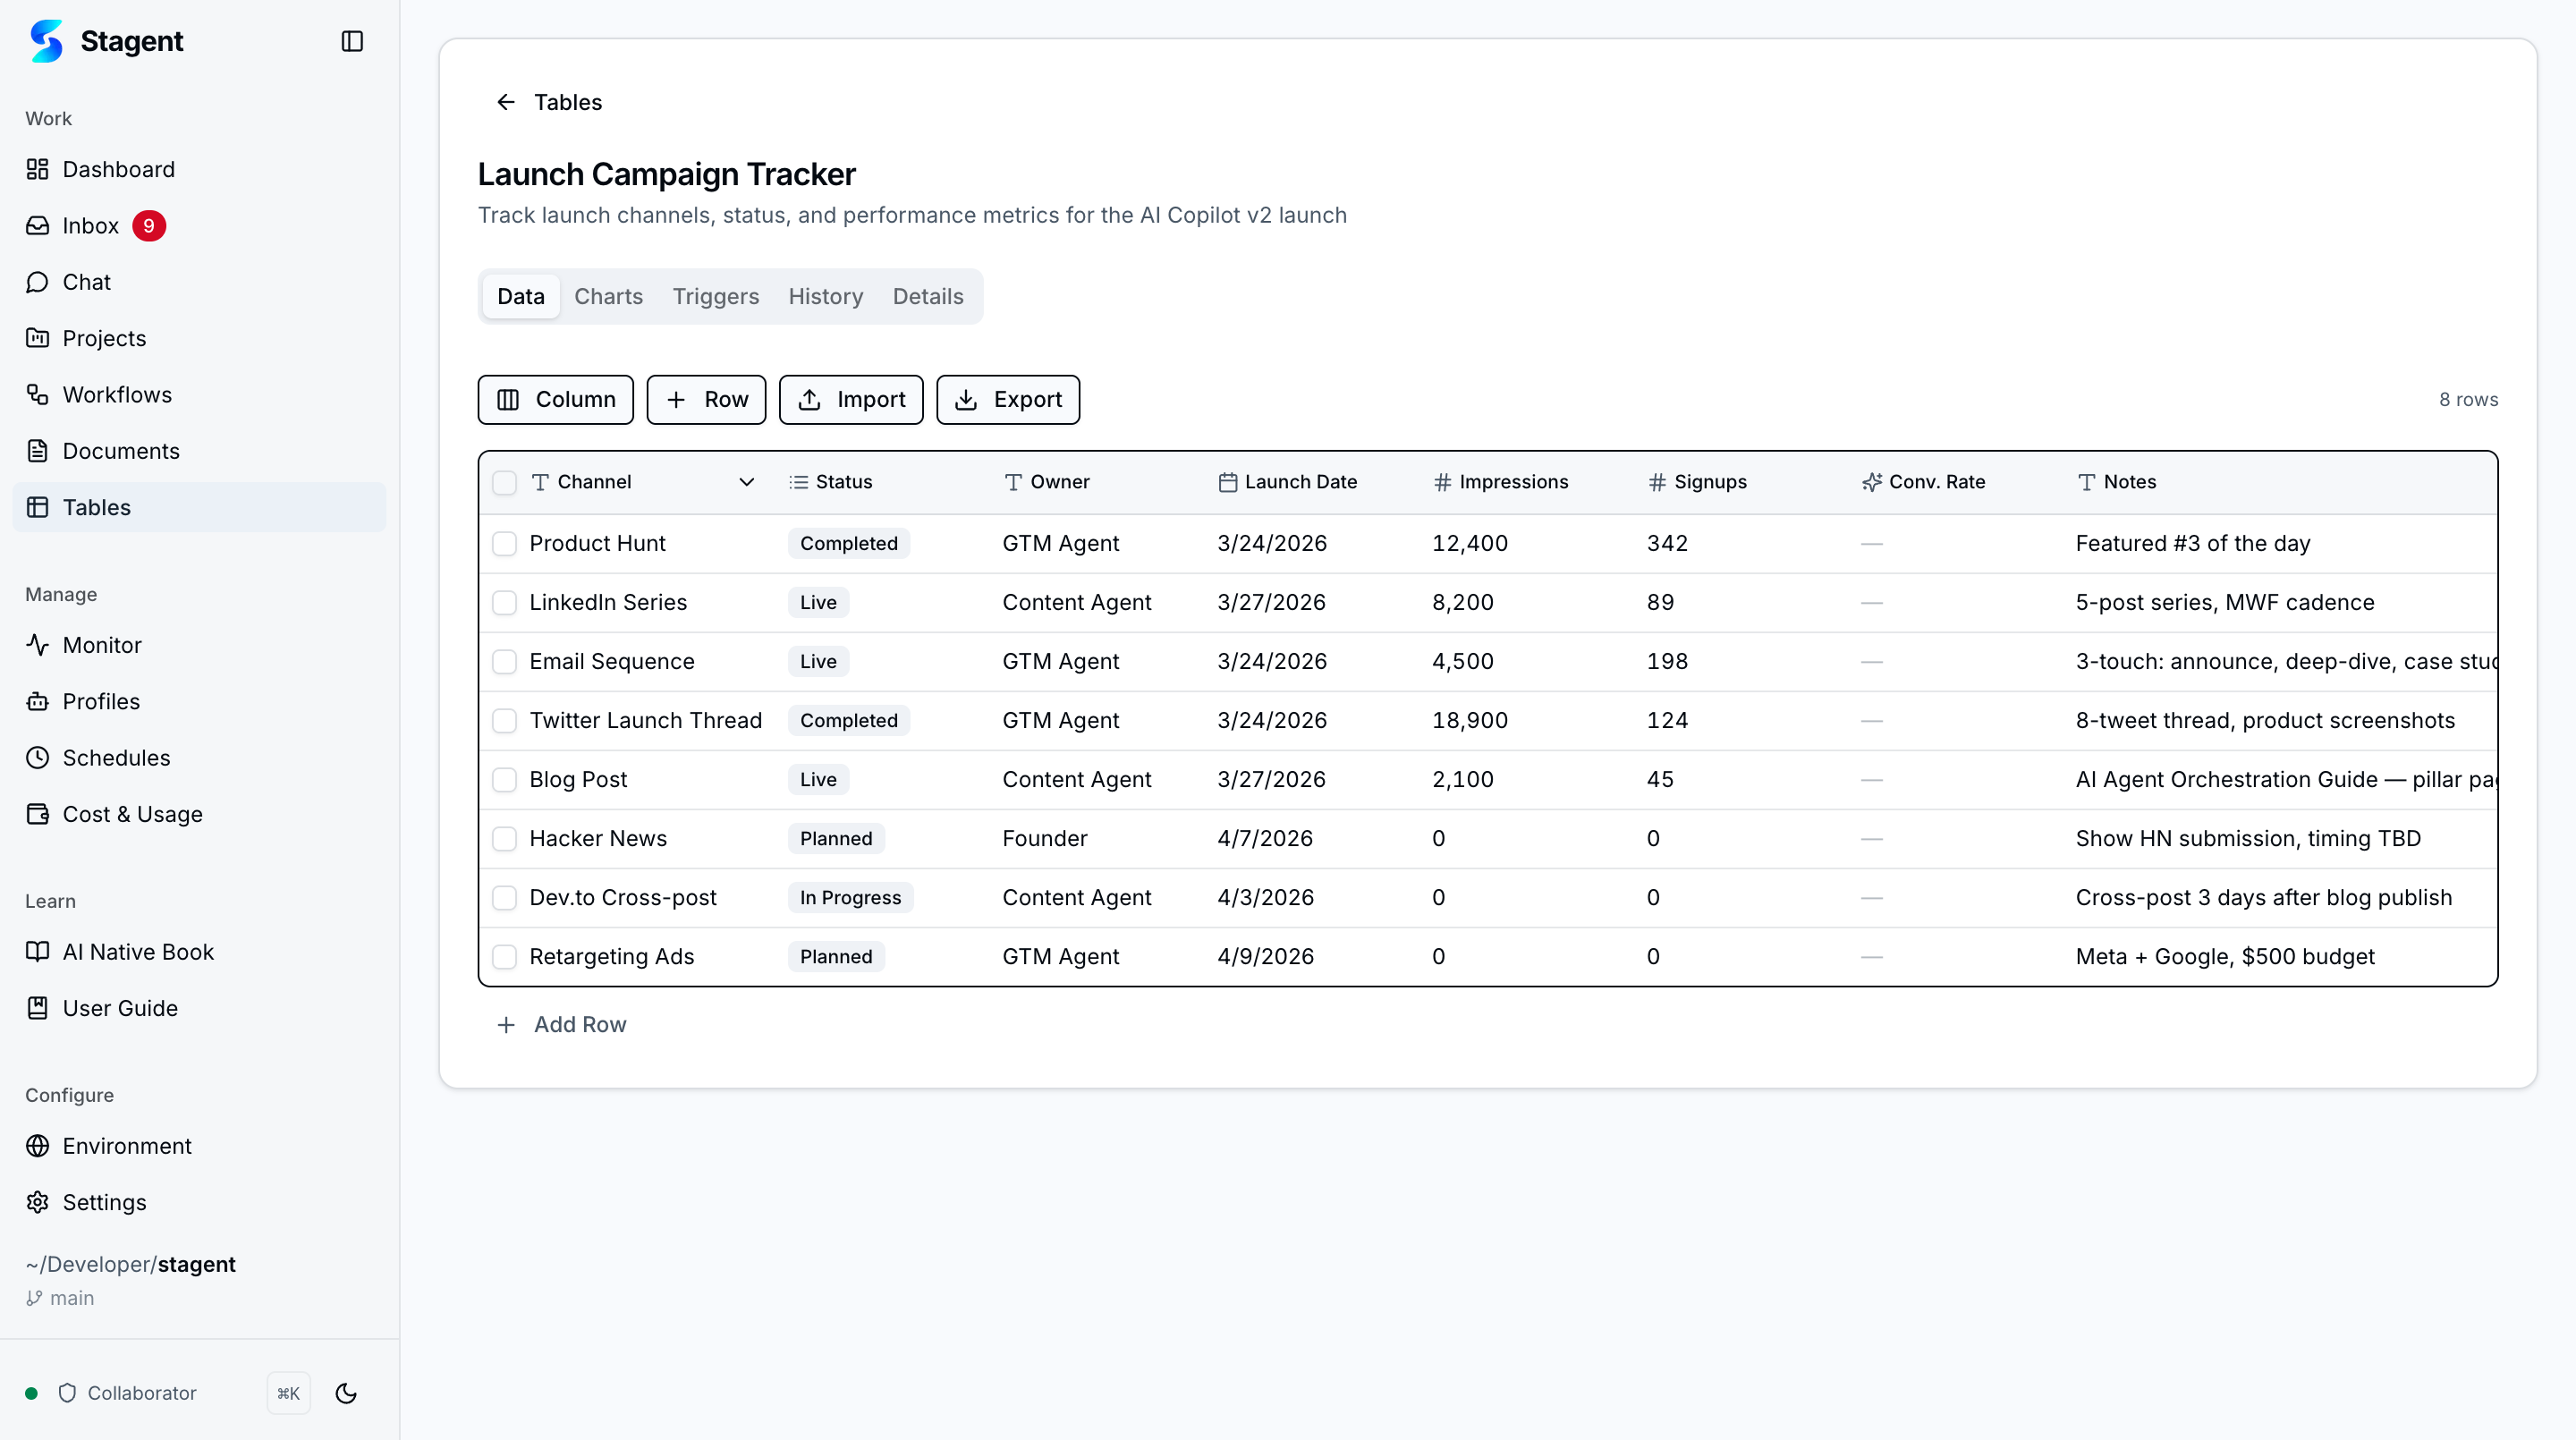
Create a table from scratch with the inline column builder, import from a file, or clone a template. The spreadsheet editor at /tables/[id] provides a full editing experience with tabbed views for Data, Charts, Triggers, History, and Details.
Charts
Build visual summaries of your table data directly from the Charts tab. Choose chart types, configure axes, and the chart updates automatically as underlying data changes.
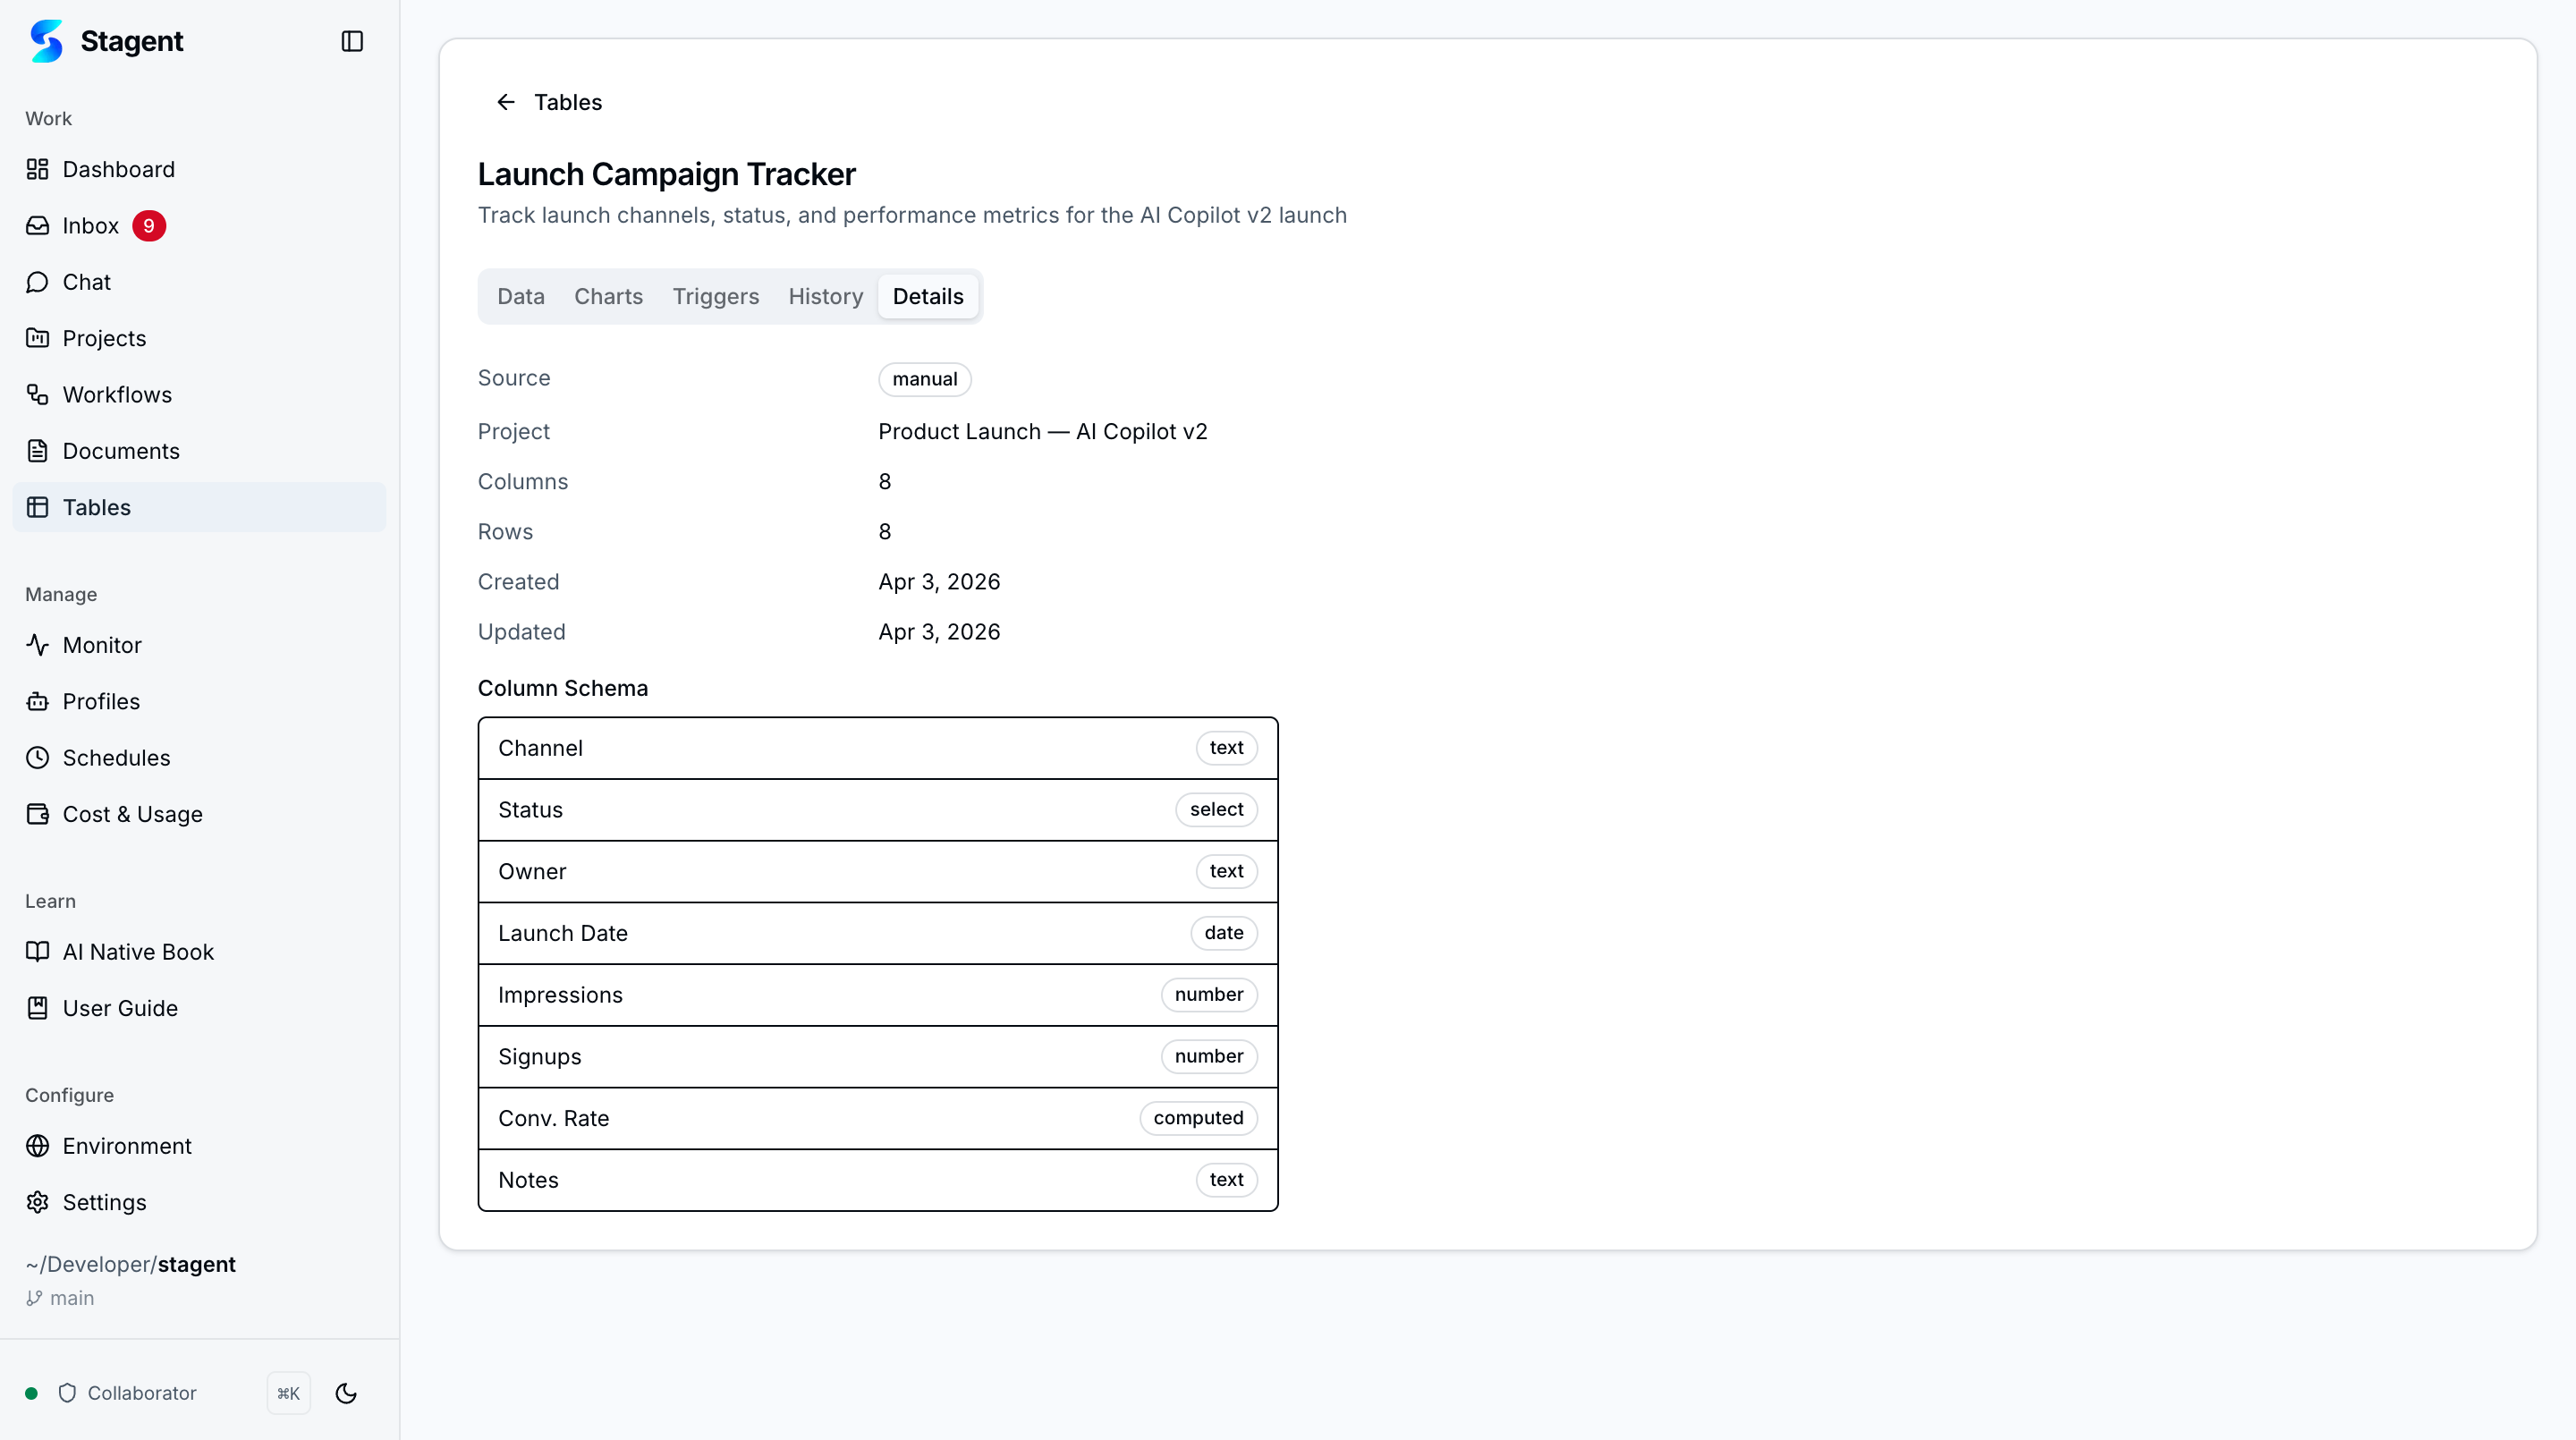
Details & Metadata
The Details tab shows table metadata, column definitions, source type, and project linkage — giving operators full visibility into the table structure.
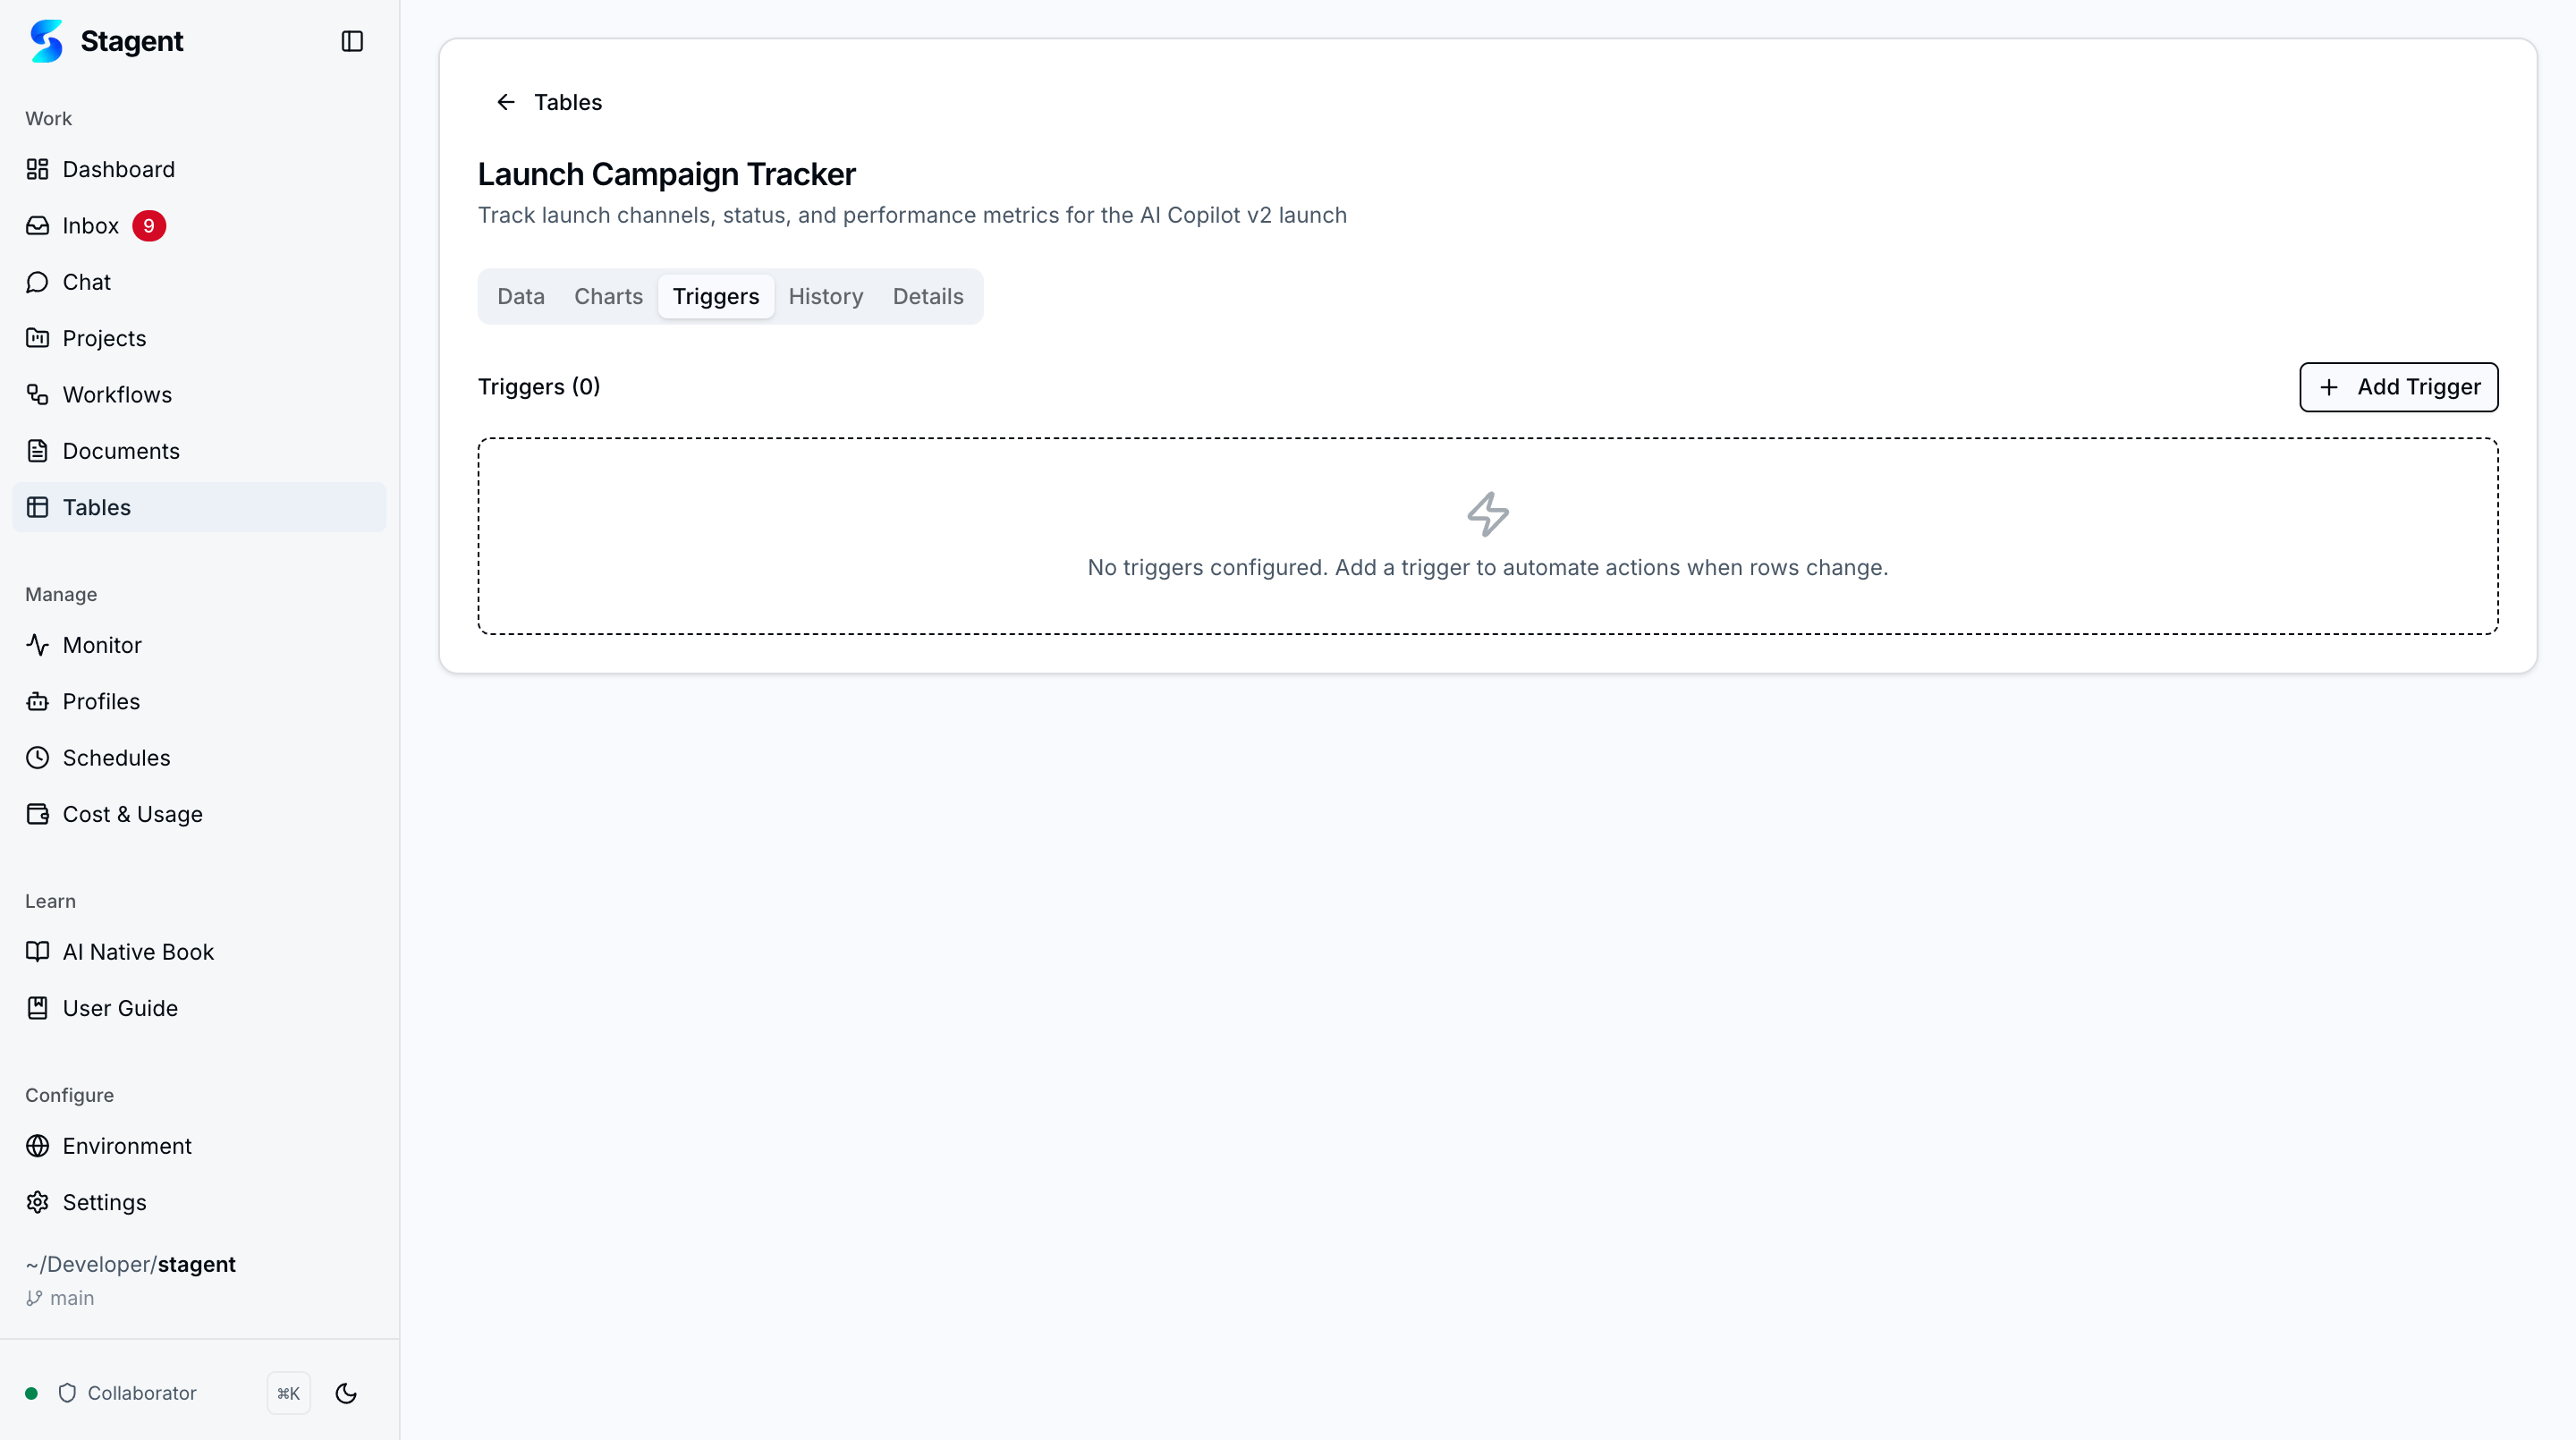
Workflow Triggers
Set up automated triggers that fire when data changes match defined conditions. Link triggers to workflows or agent tasks for hands-free operational responses.
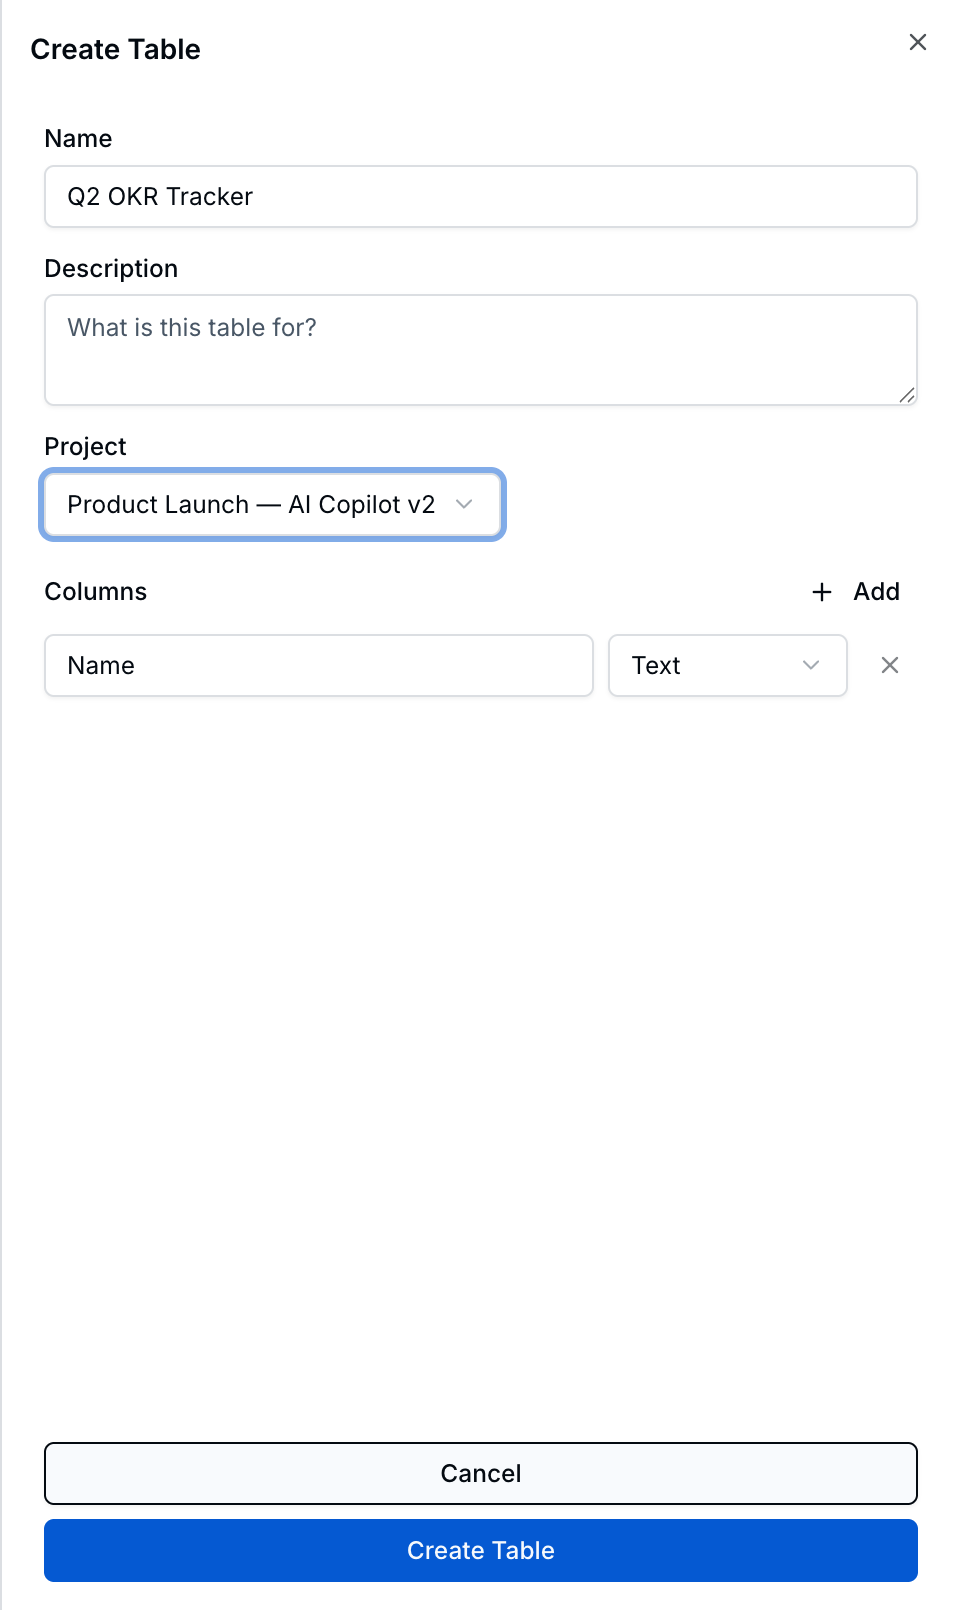
Creating Tables
The create form lets you define a table name, description, project assignment, and columns with type selection before saving.
Use Cases
Campaign Performance Tracking
Marketing Team · Monitoring launch metrics across channels
Create a launch campaign tracker with channels, dates, impressions, signups, and conversion rates. Add charts to visualize growth trends and triggers to alert when a channel exceeds targets.
Client Portfolio Management
Consulting Firm · Tracking engagement data across accounts
Import client data from a spreadsheet, add computed columns for revenue calculations, and set triggers to flag accounts approaching renewal. Agents can query the table to generate weekly portfolio summaries.
Personal Habit Tracking
Power User · Building a lightweight personal dashboard
Clone the Habit Tracker template, customize columns for your routines, and use charts to visualize streaks. Export monthly for backup or sharing.