Monitoring
The monitor is Stagent’s real-time execution feed. It complements the inbox by showing what agents are doing right now, not just the points where they need human input.
Key Concepts
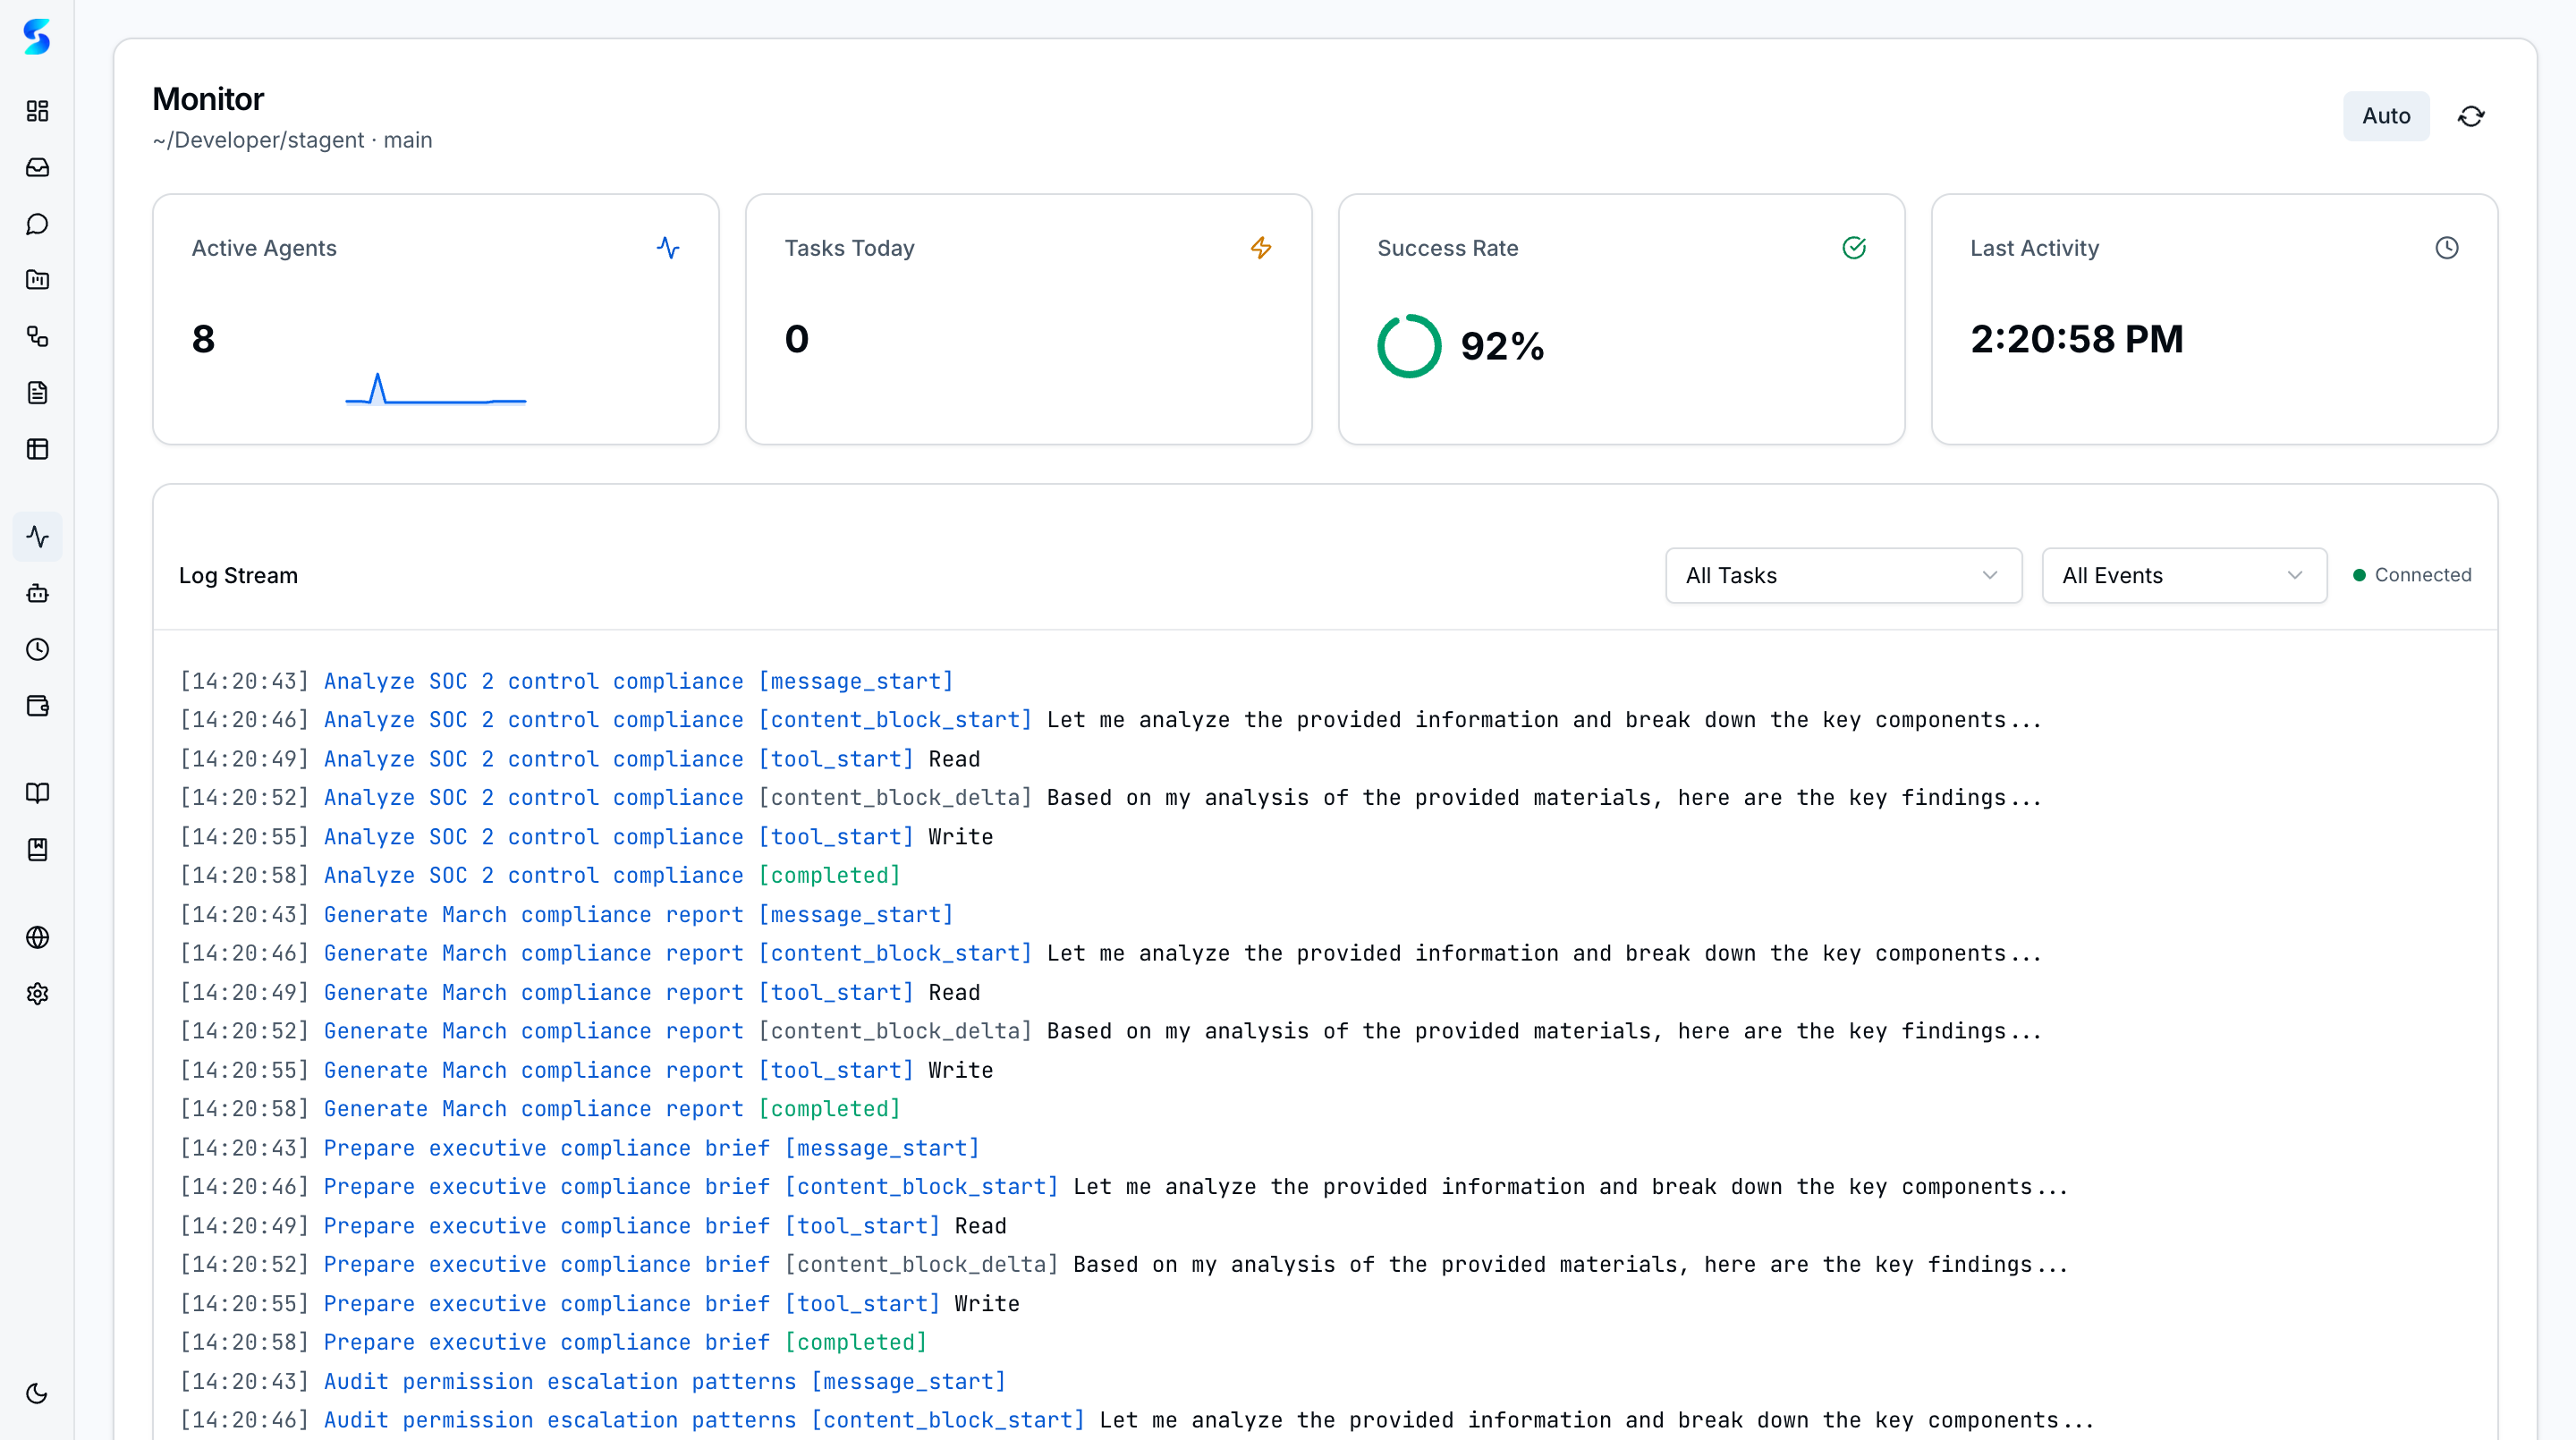
- Workspace Health Cards — Active agents, tasks today, success rate, and last activity stay visible above the log stream.
- Streaming Log View — Runtime events appear chronologically with sub-second latency so operators can follow one task or monitor the whole system.
- Task & Event Filters — Narrow the stream to one task set or one class of event (reasoning, tool calls, tool results, decisions, errors) when debugging or demoing the product.
- Click-to-Navigate — Click any log entry to jump directly to the task detail view for deeper inspection.
- Auto-Pause on Tab Switch — Streaming pauses when you switch browser tabs to save resources, then resumes and backfills missed events when you return.
- Connection Status — The monitor makes it explicit whether the stream is connected and whether auto-refresh is enabled.
- Auto-Pause on Tab Switch — Streaming pauses when you switch browser tabs to save resources, then resumes and backfills missed events when you return.
Log Entry Types
Each log entry includes:
- Timestamp — When the event happened
- Task Context — Which task or workflow step produced the event
- Event Type — Tool call, content block, completion, or other runtime marker
- Content — The event payload or summarized runtime output
How It Works
The monitor is the fastest way to understand whether work is progressing normally. Operators can keep it open during a run, then pivot to the inbox only when the agent crosses a trust boundary or needs clarification.
Because the monitor is filterable, it also works as a debugging surface. You can focus on one task, isolate one event class, and inspect the sequence that led to a failure or approval request.
Use Cases
Live Demo for Stakeholders
Product Team · Showcasing agent capabilities to executives
You project the monitor during a product demo. Stakeholders see an active log stream, success-rate card, and visible task progress instead of a black-box spinner.
Debugging a Failed Task
Developer · Tracing a failure to its root cause
A nightly task failed. You filter the log stream to the relevant task, inspect the final tool calls, and confirm whether the problem was a permissions denial, missing file, or execution error before retrying.
Overnight Batch Monitoring
Power User · Morning triage of unattended agent work
You open the monitor after a night of scheduled work and can immediately tell whether the system is healthy, which task is still active, and where intervention is needed.
Related Features
- Agent Integration — Where logs are generated
- Human-in-the-Loop — Permission requests that appear during monitoring
- Task Execution — Task context for filtered views